Single-Cell Transcriptomics Analysis
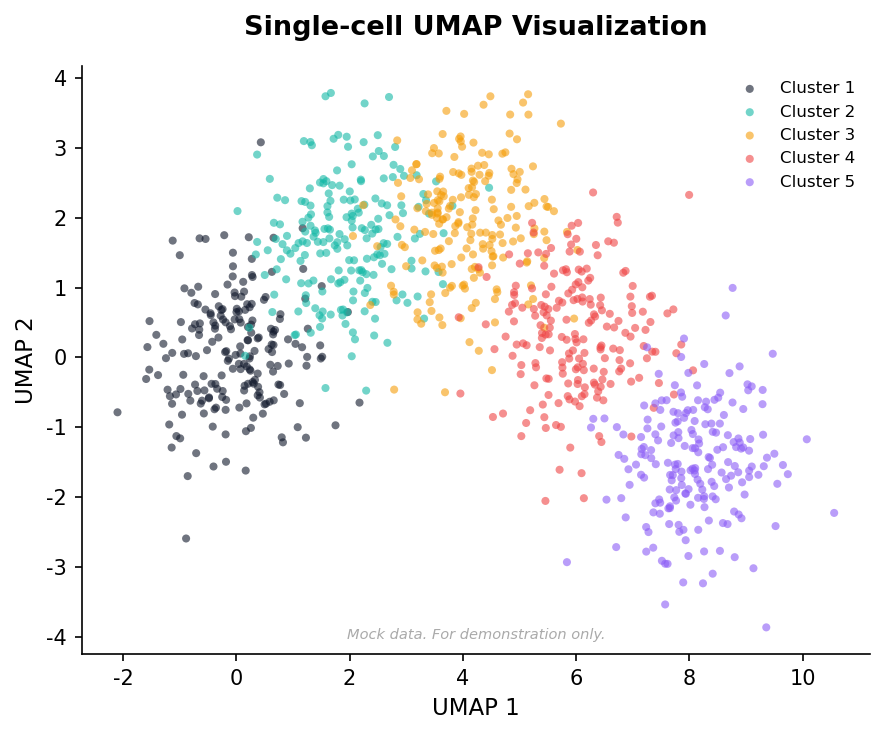
Representative UMAP clustering plot generated from mock data for layout demonstration.
This output represents the analytical approach and visualization style. Actual project results depend on input data quality, sample size, tissue dissociation method, and batch structure.
Project Question
Which immune cell populations in the tumor microenvironment show consistent patterns that can guide mechanistic hypotheses and experimental prioritization?
R&D Context
A preclinical research team needed to characterize immune cell heterogeneity in tumor microenvironment samples to inform mechanism-of-action hypotheses and guide downstream functional experiment design for an R&D evidence package.
Decision Challenge
The researchers needed to: (1) Identify which immune cell populations are differentially abundant between responder and non-responder samples; (2) Generate testable hypotheses about cell-cell interaction networks; (3) Prioritize which cell populations and markers warrant functional validation.
Analysis Strategy
Applied rigorous QC, batch correction, multi-resolution clustering, and cell-type annotation using integrated reference atlases. Performed differential abundance and differential expression analysis between conditions. Constructed ligand-receptor interaction hypotheses using curated databases.
Key Findings
Treg and exhausted CD8+ T-cell populations were significantly enriched in resistant samples. A putative Treg-macrophage interaction axis emerged as a candidate resistance mechanism. One myeloid subpopulation showed differential marker expression suggestive of immunosuppressive polarization. These patterns were consistent across biological replicates.
Why It Matters for R&D
The cell-type landscape and interaction hypotheses provide a data-driven foundation for designing follow-up functional experiments — such as depletion studies, co-culture assays, or spatial transcriptomics — and for building translational narratives around the mechanism of resistance or response.
Recommended Next Step
Validate the Treg-macrophage interaction hypothesis via co-culture or spatial transcriptomics. Assess whether the myeloid subpopulation marker is detectable by flow cytometry for downstream assay development. Consider whether the findings support a combination therapy hypothesis.
Input Data
- scRNA-seq count matrix
- Sample metadata (including treatment response labels)
- Reference marker lists
- Ligand-receptor interaction database
Deliverables
- UMAP clustering and cell-type proportion visualization
- Differential abundance and expression analysis results
- Ligand-receptor interaction hypothesis network
- Marker gene summary with validation recommendations
- Methods documentation and batch correction details